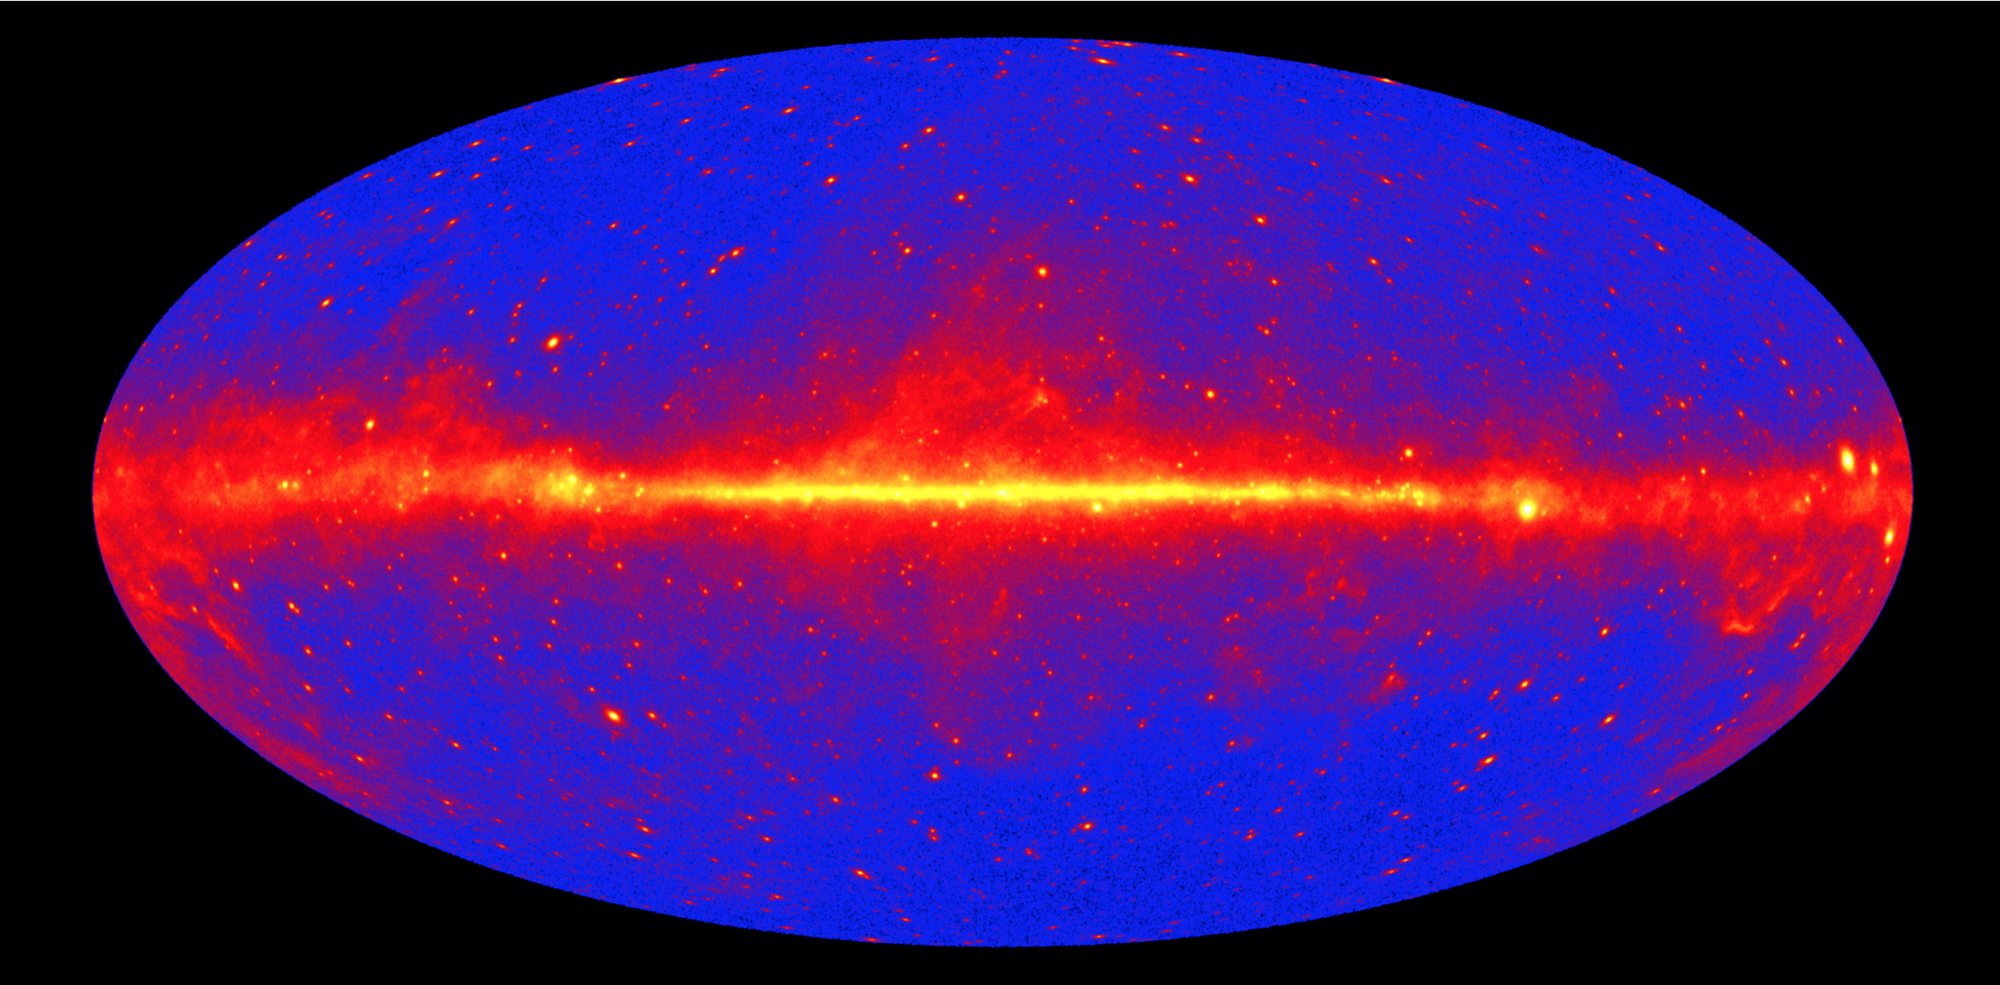
All-sky map in gamma rays, with the bright band of the Milky Way

Research area

Microquasars

Microquasars are compact Galactic systems with relativistic jets. Gamma-ray and X-ray observations test how and when those jets accelerate particles.

Microquasars are X-ray binaries with spatially resolved, extended radio emission. Their name comes from their similarity to quasars, a family of active galactic nuclei: both have a compact central object fed by accreting matter, and both launch relativistic, collimated jets. The compact objects differ hugely in mass, a few solar masses against millions, yet the radio and X-ray spectra of the two classes are remarkably alike, which suggests similar mechanisms at work. Active galactic nuclei emit up to the highest energies, and we hope to find similar emission from microquasars.

H.E.S.S. · RXTE

Searching for very-high-energy flares

We analysed contemporaneous observations of three microquasars, GRS 1915+105, Circinus X-1 and V4641 Sgr, by the H.E.S.S. telescopes and the Rossi X-ray Timing Explorer (RXTE). None of the three showed a significant gamma-ray signal. We examined the H.E.S.S. upper limits in the context of earlier Cherenkov-telescope observations of microquasars, and modelled absorption inside each system, which turned out to have a negligible effect on the escaping gamma rays. Together with the X-ray behaviour seen by RXTE, the results indicate that if detectable very-high-energy emission from microquasars is common, it is probably highly transient.

Or, in plain words: we probably observed these objects at the wrong time. I was the corresponding author of the paper, which appeared in the A&A special issue on H.E.S.S.
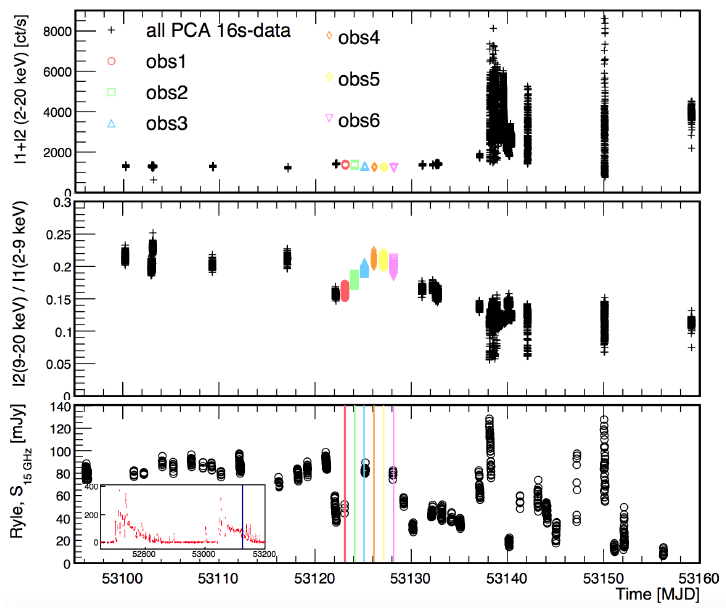
X-ray intensity, hardness and radio light curves of GRS 1915+105, with the periods of H.E.S.S. observations highlighted in colour
GRS 1915+105 around the H.E.S.S. observations, which are highlighted in colour. Top, RXTE PCA intensity; middle, X-ray hardness; bottom, contemporaneous 15 GHz radio data from the Ryle Telescope.

GRS 1915+105

Where the observations fall

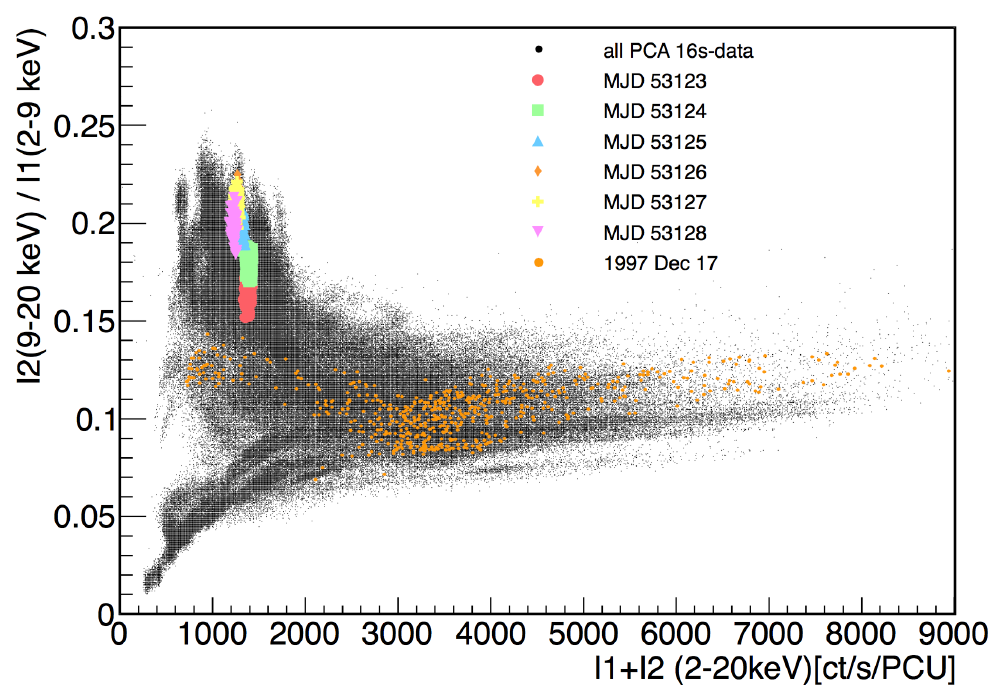
The hardness–intensity diagram places the H.E.S.S. observations in the context of the whole RXTE mission and of periods of known high X-ray activity.

Hardness-intensity diagram of GRS 1915+105 from the full RXTE mission, with the H.E.S.S. observation periods highlighted
Hardness–intensity diagram of GRS 1915+105 from all RXTE PCA data (black), with the periods of H.E.S.S. observations highlighted by coloured markers and, for comparison, periods of known high X-ray activity.