Microquasars are X-ray binaries that exhibit spatially resolved, extended radio emission. Their name is motivated by the structural similarity with the quasar family of active galactic nuclei (AGN). Both object classes are believed to comprise a compact central object embedded in a flow of accreting material, and both exhibit relativistic, collimated jets. Although the masses of the compact objects are hugely different (a few solar masses for microquasars compared to millions of solar masses for "real" quasars), remarkable similarities in the spectral properties of both radio and X-ray emissions have been found over the last years. One might therefore expect to find similar mechanisms at play. AGN are known as powerful emitters of electromagnetic radiation up to the highest energies and we hope to find similar emissions also from microquasars.
A search for very high-energy flares from the microquasars GRS 1915+105, Circinus X-1, and V4641 Sgr using contemporaneous H.E.S.S. and RXTE observations
A long title but no signal...
We analyzed contemporaneous observations by the H.E.S.S. TeV gamma-ray telescope array and the Rossi X-ray Timing Explorer (RXTE) satellite of three microquasars, GRS 1915+105, Circinus X-1, and V4641 Sgr. No significant γ-ray signal has been detected in any of the three systems. The obtained gamma-ray upper limits using H.E.S.S. were examined in the context of previous Cherenkov telescope observations of microquasars. We also modeled the effect of intrinsic absorption for each target and found negligible impact on the flux of escaping gamma-rays. When combined with the X-ray behavior observed using RXTE, the derived results indicate that if detectable VHE gamma-ray emission from microquasars is commonplace, then it is likely to be highly transient.
A scientists way of saying: "We probably have observed the objects at the wrong time!" ;-)
I presented the finding at the 34th International Cosmic Ray Conference (The Hague, 2015): Simultaneous H.E.S.S. and RXTE observations of the microquasars GRS 1915+105, Circinus X-1 and V4641 Sgr
The paper summarizing the analyses has been accepted by A&A in early 2016 and will be included in a special issue about H.E.S.S..
|
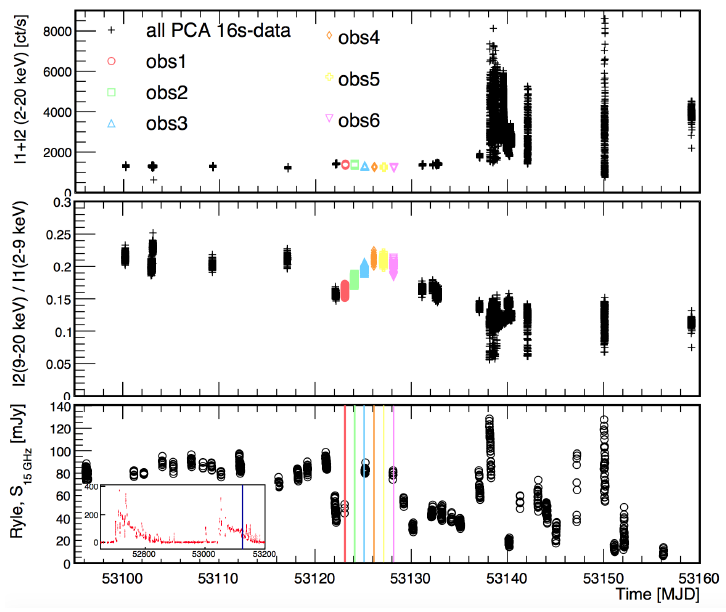
Evolution of GRS 1915+105 around the H.E.S.S. observations. Data corresponding to H.E.S.S. observations are highlighted with colors.
Top panel: Intensity of the RXTE PCA data. Middle panel: evolution of the Hardness derived from RXTE PCA data. Bottom panel: contemporaneous radio data obtained with the Ryle Telescope (15 GHz [10 ]). A larger, 550 day, time period is depicted in the inset. From H.Abdalla et al. (H.E.S.S. Collaboration), A&A (2016). |
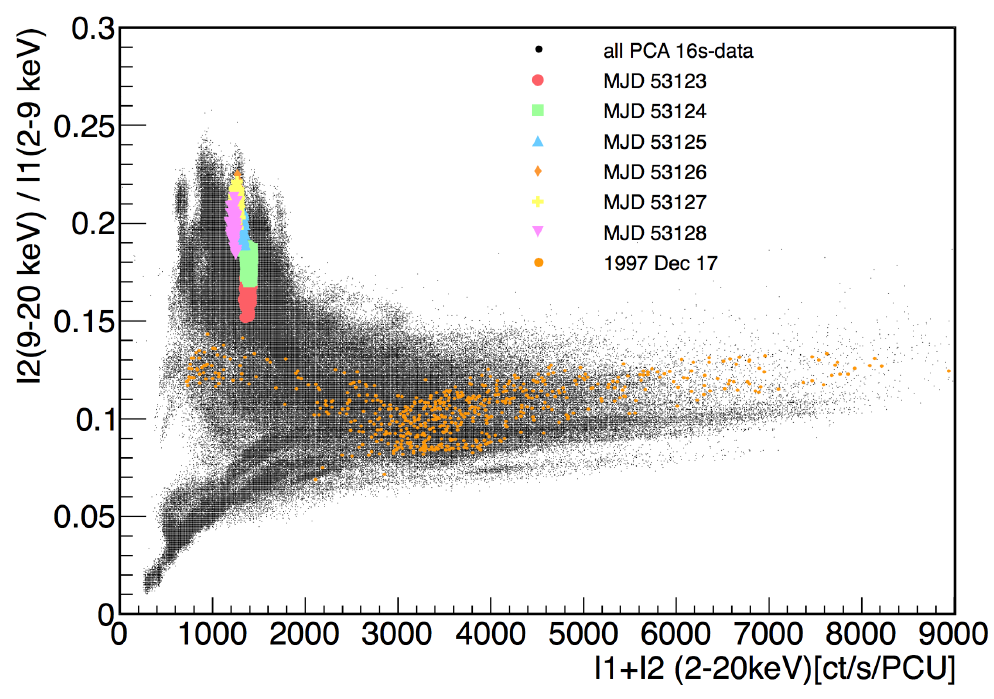
Hardness-Intensity diagrams of GRS 1915+105 obtained with the RXTE PCA data taken during the whole mission of the satellite (black points). Data corresponding to H.E.S.S. observations are highlighted by colored markers. For comparison, periods of known high X-ray activity are also highlighted. From H.Abdalla et al. (H.E.S.S. Collaboration), A&A (2016).
|

